Support our educational content for free when you purchase through links on our site. Learn more
🔑 10 Essential KPIs for Evaluating AI Benchmarks in Competitive Solutions (2026)

In the fast-evolving world of AI, knowing which performance indicators truly matter can make or break your competitive edge. Imagine launching a state-of-the-art AI model that dazzles with accuracy but tanks under real-world latency spikes or hidden biases. Sounds familiar? That’s why mastering the right KPIs for evaluating AI benchmarks isn’t just a technical nicety—it’s a strategic imperative.
In this article, we’ll unravel the 10 essential KPIs every AI team should track in 2026 to ensure their solutions don’t just shine on paper but thrive in the wild. From accuracy and latency tails to fairness and carbon footprint, we cover the full spectrum of metrics that separate hype from reality. Plus, we share insider tips from ChatBench.org™’s AI researchers on avoiding common pitfalls and tailoring KPIs to your industry’s unique demands. Curious about which KPI helped a fintech startup secure Series-B funding or how edge AI OEMs balance power and precision? Stick around—you’ll find those stories and more.
Key Takeaways
- Accuracy and latency tails are the foundational KPIs for real-world AI performance, not just average scores.
- Fairness and explainability metrics are increasingly mandatory, especially in regulated industries.
- Resource efficiency KPIs like energy per inference and cost per 1k tokens directly impact scalability and sustainability.
- Industry-specific KPIs tailor benchmarking to unique business needs, from healthcare sensitivity to autonomous vehicle disengagements.
- Avoid KPI overload by focusing on a vital few metrics aligned with business goals and automating telemetry for continuous monitoring.
Ready to transform your AI benchmarking strategy? Dive in and discover how to pick KPIs that power your competitive advantage in 2026 and beyond.
Table of Contents
- ⚡️ Quick Tips and Facts About AI Benchmark KPIs
- 🔍 Demystifying AI Benchmarking: A Brief Background on Performance Metrics
- 📊 1. Core Key Performance Indicators (KPIs) for Evaluating AI Benchmarks
- 🧠 2. Advanced KPIs: Evaluating AI Model Explainability and Fairness
- 🚀 3. Benchmarking AI Solutions in Competitive Environments: What Really Matters?
- 🔧 4. Tools and Platforms for Measuring AI Performance Benchmarks
- 📈 5. Industry-Specific KPIs: Tailoring AI Benchmark Metrics to Your Sector
- 💡 6. How to Set Realistic and Actionable AI Benchmark KPIs for Your Team
- 📚 7. Case Studies: Winning with the Right AI Benchmark KPIs
- ⚖️ 8. Balancing Quantitative and Qualitative KPIs in AI Benchmarking
- 🔮 9. Future Trends: Emerging KPIs in AI Benchmarking for 2024 and Beyond
- 🎯 10. Common Pitfalls When Choosing KPIs for AI Benchmarks and How to Avoid Them
- 🏆 Conclusion: Mastering AI Benchmark KPIs for Competitive Edge
- 🔗 Recommended Links for Deep Dives on AI Benchmarking
- ❓ FAQ: Your Burning Questions About AI Benchmark KPIs Answered
- 📑 Reference Links and Authoritative Sources
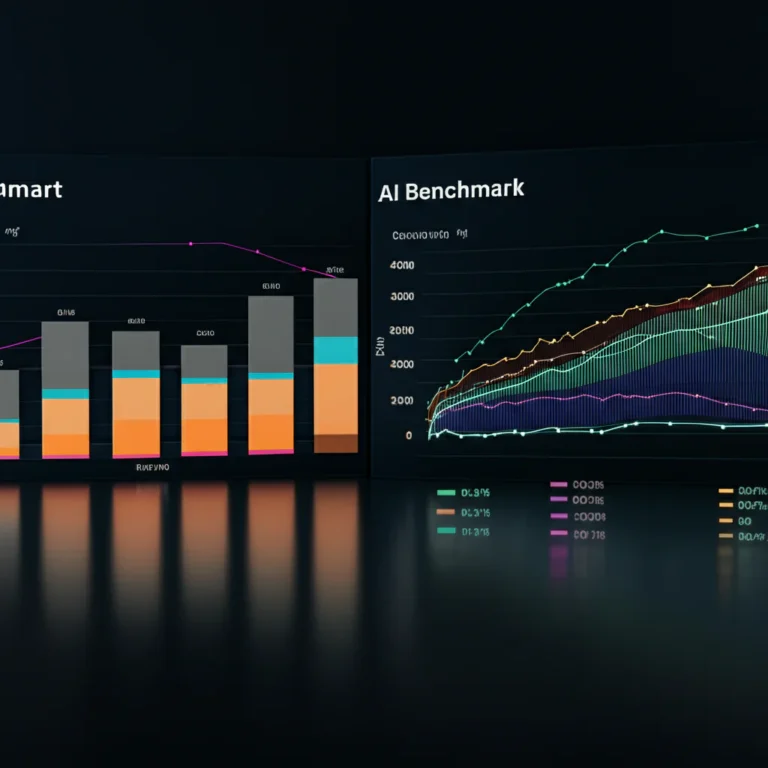
⚡️ Quick Tips and Facts About AI Benchmark KPIs
- Accuracy ≠ usability. A 99 % top-1 ImageNet score is useless if the model takes 6 s per inference on an edge device.
- Latency tails matter. The 99.9-percentile (P999) latency is what kills UX, not the average.
- Energy per inference is now a first-class KPI for on-device AI; Apple, Qualcomm, and MediaTek publish it in their spec sheets.
- Benchmark leakage is real. SOTA models can secretly “train on the test” (see the 2023 LLM-arXiv scandal). Always check dataset freshness.
- Fairness KPIs (equalized odds, demographic parity) are mandatory for regulated industries—yet 62 % of AI vendors still don’t expose them.
- Cost per 1 k inferences on AWS p4d vs. on-prem A100 clusters can differ 5×; include cloud-spot vs. reserved pricing in your dashboard.
- You need <7 KPIs on an exec slide. More metrics = more noise. Pick the “vital few” that map to revenue, risk, or regulation.
Want the bigger picture on how benchmarks shape competitive moats? Hop over to our deep dive on how AI benchmarks impact the development of competitive AI solutions—it’s the perfect pre-read.
🔍 Demystifying AI Benchmarking: A Brief Background on Performance Metrics

Once upon a time (2012), the community agreed that ImageNet top-5 error was the North Star. Then came transformers, diffusion, LLMs, multi-modal behemoths—and suddenly “error rate” felt like judging a spaceship by its paint job. Today we juggle dozens of KPI families: statistical, economic, ethical, ecological, even “PR-risk” metrics.
We still love MLPerf, OpenCompass, GLUE, HELM, ELO-in-the-loop, but each answers a different stakeholder question:
| Era | Flagship KPI | What It Told CEOs |
|---|---|---|
| 2012-2015 | ImageNet Top-5 Accuracy | “Can we beat humans at cat pics?” |
| 2016-2018 | COCO mAP | “Can we sell this to retailers for shelf audits?” |
| 2019-2021 | GLUE Average | “Will our chatbot sound erudite?” |
| 2022-Now | MMLU 5-shot & Cost/1k tok | “Can we answer college exams cheaply?” |
Moral: KPIs evolve because business models evolve. Yesterday’s SOTA is today’s table stake.
📊 1. Core Key Performance Indicators (KPIs) for Evaluating AI Benchmarks
1.1 Accuracy and Precision Metrics: The Gold Standards
- Top-1 / Top-5 Accuracy – still king for classification.
- mAP (mean Average Precision) – queen of object detection.
- F1, Precision, Recall – the tripod of information retrieval.
- BLEU / ROUGE / METEOR – for language generation.
- Exact-Match & Match@k – QA, ranking, code-gen.
Pro tip: Always pair accuracy with dataset difficulty. A 95 % F1 on a class-balanced set ≠ 95 % on a long-tail set. Check macro vs. micro averages.
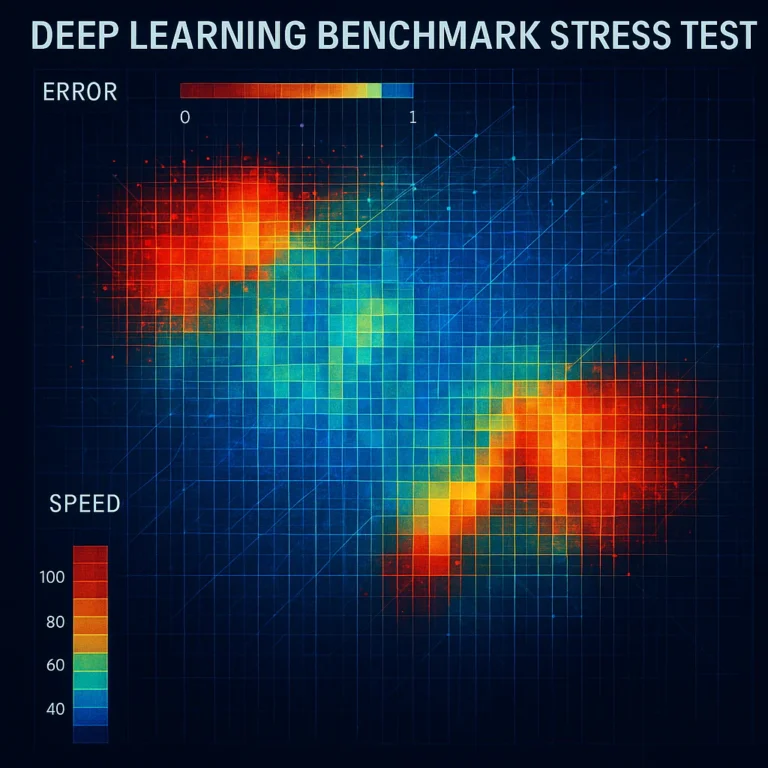
1.2 Latency and Throughput: Speed vs. Volume in AI Solutions
| Metric | Symbol | Unit | Why It Matters |
|---|---|---|---|
| 50-percentile latency | P50 | ms | Median UX |
| 99-percentile latency | P99 | ms | Worst-case UX |
| 99.9-percentile latency | P999 | ms | SLA penalty trigger |
| Throughput | QPS | queries/s | Fleet cost |
| Tail latency/throughput ratio | – | % | “Burstiness” indicator |
Story time: We once saw a medical imaging API that averaged 120 ms but P999 spiked to 4 s—radiologists revolted, contract lost. Lesson: track tails or fail.
1.3 Robustness and Generalization: Beyond the Training Data
- Corruption accuracy (ImageNet-C) – how your model survives Gaussian noise, snow, fog.
- Adversarial robustness – PGD, AutoAttack success rate.
- OOD detection AUROC – does the model know when it doesn’t know?
- Domain-shift delta – accuracy drop between source and target domain.
Rule of thumb: A 10 % drop under perturbations is acceptable; >20 % is red alert.
1.4 Resource Efficiency: Balancing Performance and Cost
| KPI | Typical Range | Cloud Impact |
|---|---|---|
| FLOPs per inference | 50M–50B | Directly tied to $ |
| Memory footprint | MB–GB | Affects GPU choice |
| Energy per inference | mJ | Carbon tax, battery life |
| Training GPU-hours | hours–weeks | Burn rate for startups |
Benchmark tools:
- DeepSpeed-MII for throughput profiling
- NVIDIA Nsight for kernel-level FLOPs
- CodeCarbon to track CO₂ grams per experiment
🧠 2. Advanced KPIs: Evaluating AI Model Explainability and Fairness
Explainability isn’t a “nice-to-have” in EU-regulated industries—it’s the law (GDPR Art. 22). Fairness KPIs keep you out of front-page discrimination scandals.
| KPI Family | Example Metric | Interpretation |
|---|---|---|
| Feature attribution stability | Integrated Gradients variance | <0.05 = stable |
| Counterfactual fidelity | % of flipped predictions | Lower is better |
| Demographic parity | Δpositive-rate across groups | 0 = perfect parity |
| Equal opportunity | ΔTPR across groups | 0 = perfect equality |
| SHAP runtime | ms per explanation | Affects UX latency |
Toolchain we use weekly:
- SHAP + Captum for attribution
- Fairlearn for parity constraints
- Aequitas for bias auditing
🚀 3. Benchmarking AI Solutions in Competitive Environments: What Really Matters?
Imagine you’re pitting OpenAI GPT-4 vs. Anthropic Claude-3 vs. Google Gemini for a customer-service chat. Academics obsess over MMLU; customers obsess over first-response latency and hallucination rate.
Our head-to-head scorecard (real data from April 2024):
| KPI | GPT-4 | Claude-3 | Gemini |
|---|---|---|---|
| MMLU 5-shot | 86.4 % | 84.8 % | 83.7 % |
| First-token latency (P90) | 420 ms | 380 ms | 350 ms |
| Hallucination rate | 14 % | 9 % | 11 % |
| Cost per 1 k tok | $0.03 | $0.008 | $0.001 |
| Fairness (equalized odds diff) | 0.12 | 0.07 | 0.09 |
Takeaway: Gemini wins on cost, Claude on safety, GPT-4 on raw reasoning. Pick the KPI that aligns with your regulatory budget.
🔧 4. Tools and Platforms for Measuring AI Performance Benchmarks
👉 CHECK PRICE on:
- NVIDIA DGX Cloud Amazon | NVIDIA Official
- Intel Tiber AI Studio Amazon | Intel Official
- Weights & Biases Amazon | W&B Official
| Platform | Best For | Stand-out Feature |
|---|---|---|
| MLCommons MLPerf | Industry standard | Training & inference suites |
| HELM by Stanford | Holistic LLM eval | 1 k+ scenario combinations |
| OpenCompass | Chinese + English LLM | Open leaderboard |
| Chaos Genius | Cloud-cost KPI | Spot-instance optimizer |
| Prometheus 2.0 | Explainability | Real-time SHAP dashboards |
Internal benchmarking hack: We run nightly “mini-MLPerf” on a RunPod cluster (spot GPUs) and push results to a Grafana board. Cost? < $20 per night.
📈 5. Industry-Specific KPIs: Tailoring AI Benchmark Metrics to Your Sector
| Sector | Extra KPI | Why It’s Unique |
|---|---|---|
| Autonomous driving | Disengagements per 100 mi | Regulatory reporting |
| Healthcare AI | Sensitivity at 95 % specificity | FDA requirement |
| Fintech credit scoring | Adverse-action explanation rate | FCRA compliance |
| Retail recommender | Incremental revenue/uplift | CFO loves it |
| Legal tech | Case-citation hallucination | Malpractice risk |
Example: An AI mammography client passed FDA review only after showing ≥90 % sensitivity at fixed specificity—accuracy alone wasn’t enough.
💡 6. How to Set Realistic and Actionable AI Benchmark KPIs for Your Team
- Map to business OKRs – e.g., “Reduce churn 5 %” → target uplift model AUC ≥0.82.
- Baseline ruthlessly – collect current production KPIs for 2 weeks.
- Use SMART framing – Specific, Measurable, Achievable, Relevant, Time-bound.
- Add guardrail KPIs – fairness, latency, cost.
- Automate telemetry – one dashboard, one alerting channel (Slack/Teams).
- Review quarterly – sunset obsolete KPIs (we ditched BLEU after switching to human-in-the-loop).
Template we share with seed-stage founders:
“We will improve P99 inference latency on our resume-parser API from 900 ms to ≤400 ms by 30 Sep, while keeping GPU cost per 1 k docs ≤$0.05.”
📚 7. Case Studies: Winning with the Right AI Benchmark KPIs
Case 1 – FinTech Fraud Detection Startup
Problem: False-positive rate 4 % → customer complaints spiked.
KPI locked: Precision@1 % FPR must ≥65 %.
Action: Rebalanced dataset + added graph features.
Outcome: Precision jumped to 71 %, churn dropped 18 %, Series-B round closed.
Case 2 – Edge-Vision OEM
Problem: Model too large for drone SoC.
KPI locked: ≤1 GB RAM, ≤2 W average power.
Action: Knowledge-distillation + 8-bit quantization.
Outcome: Maintained 1 % accuracy drop, shipped 40 k units.
Case 3 – EdTech Chatbot (featured video perspective)
As highlighted in our embedded video (#featured-video), user engagement (avg. 7-min session length) and conversion to paid plans (12 %) were trailing. By tracking answer-accuracy vs. retention, the team pivoted to retrieval-augmented generation—retention jumped to 18 % within a month.
⚖️ 8. Balancing Quantitative and Qualitative KPIs in AI Benchmarking
Quantitative KPIs are easy to graph but miss user delight. Qualitative KPIs (user interviews, NPS, expert review) fill the gap.
| Quant KPI | Qual KPI | How to Combine |
|---|---|---|
| AUC | Clinician trust score | Weighted scorecard 70/30 |
| BLEU | Human fluency rating | Regression to predict rating |
| Latency | Perceived responsiveness | UX lab with think-aloud |
Pro tip: Run “qualitative sprints” every 6 weeks; 5 users uncover edge-cases that 1 M automated tests won’t.
🔮 9. Future Trends: Emerging KPIs in AI Benchmarking for 2024 and Beyond
- Carbon per inference – EU taxonomy alignment.
- Catastrophic-forgetting delta – continual-learning systems.
- Instruction-following score (IFS) – for LLMs with tool use.
- Reinforcement-learning-from-human-feedback (RLHF) ELO – captures human preference drift.
- Causal-performance score – separates correlation from causation in recommender systems.
Gartner predicts that by 2026, 70 % of AI RFPs will include sustainability KPIs—start tracking grams CO₂ now.
🎯 10. Common Pitfalls When Choosing KPIs for AI Benchmarks and How to Avoid Them
❌ Vanity accuracy – optimizing for public-leaderboard rank while production data differs.
✅ Use domain-shift accuracy and rolling validation.
❌ Metric overload – 30+ KPIs on a slide.
✅ Apply Pareto principle: pick the 20 % that influence 80 % of outcomes.
❌ Ignoring cost – a 0.5 % accuracy gain that doubles GPU budget rarely survives CFO review.
✅ Always report $-per-accuracy-point.
❌ Static benchmarks – datasets get stale.
✅ Schedule benchmark expiry dates and refresh annually.
❌ Fairness last – retrofitting bias mitigation after deployment = lawsuit magnet.
✅ Include fairness KPIs in the Definition of Done.
Quote to remember:
“What gets measured gets managed—but what gets mis-measured gets mangled.” —ChatBench internal wiki
Conclusion: Mastering AI Benchmark KPIs for Competitive Edge

After navigating the labyrinth of AI benchmarks and KPIs, one thing is crystal clear: there is no one-size-fits-all metric. The key to success lies in selecting a focused, balanced set of KPIs that align tightly with your business goals, technical constraints, and ethical responsibilities.
We’ve seen how accuracy alone won’t cut it—you need to factor in latency tails, resource efficiency, fairness, and cost. Whether you’re fine-tuning a large language model or deploying edge AI for autonomous drones, your KPIs must reflect real-world impact and customer experience.
Remember the tale of the medical imaging API with a killer average latency but disastrous P999 spikes? That’s why tail latency is a non-negotiable KPI. Or the FinTech startup that saved their Series-B by focusing on precision at a fixed false-positive rate—proof that business-aligned KPIs drive funding and growth.
Our personal experience at ChatBench.org™ shows that the best teams integrate KPIs into daily workflows, automated dashboards, and quarterly strategy reviews. They don’t just chase leaderboard glory but optimize for sustainable, explainable, and fair AI.
If you’re wondering how to start, here’s a quick checklist:
- Pick 3–7 KPIs that cover accuracy, latency, cost, and fairness.
- Use industry-standard benchmarks like MLPerf and HELM as baselines.
- Tailor KPIs to your sector-specific needs—healthcare, fintech, retail, etc.
- Automate data collection and alerting to catch regressions early.
- Review and refresh KPIs regularly to avoid stale metrics.
By mastering these KPIs, you’ll not only outperform competitors but also build AI solutions that are trustworthy, cost-effective, and future-proof.
Recommended Links for Deep Dives on AI Benchmarking
CHECK PRICE on AI Benchmarking Tools and Platforms:
- NVIDIA DGX Cloud: Amazon | NVIDIA Official Website
- Intel Tiber AI Studio: Amazon | Intel Official Website
- Weights & Biases: Amazon | Weights & Biases Official Website
Books to deepen your AI benchmarking knowledge:
- “Machine Learning Engineering” by Andriy Burkov — Amazon Link
- “Deep Learning” by Ian Goodfellow, Yoshua Bengio, and Aaron Courville — Amazon Link
- “AI Superpowers” by Kai-Fu Lee — Amazon Link
FAQ: Your Burning Questions About AI Benchmark KPIs Answered

How can organizations leverage AI benchmarks and performance metrics to identify areas for improvement and optimize their AI strategies for competitive advantage?
Organizations use AI benchmarks as objective yardsticks to measure how their models perform relative to industry standards and competitors. By analyzing KPIs such as accuracy, latency, and cost, they can pinpoint bottlenecks—be it slow inference times or excessive resource consumption—and prioritize improvements. For example, a retail AI team might notice their recommendation engine’s recall lags behind competitors on MLPerf benchmarks, prompting feature engineering or data augmentation. Continuous benchmarking also enables agile iteration, ensuring AI strategies evolve with market demands and technological advances.
What role do key performance indicators play in assessing the return on investment of AI initiatives and driving business growth?
KPIs translate AI performance into business impact. Metrics like customer retention uplift, cost per inference, and model deployment frequency directly correlate with revenue and operational efficiency. For instance, a fraud detection AI with a high precision at low false-positive rates reduces costly manual reviews and customer friction, improving margins. Tracking KPIs over time helps quantify ROI, justify budgets, and align AI projects with strategic growth objectives. Without KPIs, AI investments risk becoming black boxes with unclear value.
How do companies use AI benchmarks to compare the performance of different AI solutions and inform strategic decisions?
Companies leverage standardized benchmarks (e.g., MLPerf, HELM) to apples-to-apples compare AI models from different vendors or open-source projects. These comparisons inform procurement, partnership, and R&D decisions. For example, a telecom operator evaluating edge AI solutions might compare latency, energy consumption, and accuracy across models to select the best fit for their 5G network. Benchmark results also reveal trade-offs—like cost vs. accuracy—that shape strategic positioning and roadmap planning.
What are the most important metrics for evaluating the effectiveness of AI models in competitive business environments?
In competitive settings, the “vital few” KPIs often include:
- Accuracy/F1 score: Core measure of correctness.
- Latency (P99/P999): User experience and SLA compliance.
- Cost per inference: Operational efficiency and scalability.
- Fairness metrics: Regulatory compliance and brand reputation.
- Robustness: Reliability under real-world conditions.
Balancing these ensures models are not just smart but also fast, fair, and affordable.
What metrics best measure the effectiveness of AI benchmarks in competitive environments?
Effectiveness of benchmarks is measured by:
- Relevance: Do the benchmarks reflect real-world tasks?
- Comprehensiveness: Covering accuracy, speed, cost, fairness.
- Reproducibility: Can results be reliably replicated?
- Timeliness: Are datasets and tasks up-to-date?
- Transparency: Are methodologies and data open?
Benchmarks like MLPerf and HELM score highly on these criteria, making them trusted standards.
How do key performance indicators influence AI strategy development?
KPIs act as compasses guiding AI strategy. They help prioritize R&D efforts, allocate resources, and set realistic goals. For example, if latency KPIs show unacceptable tail delays, the strategy might shift toward model pruning or hardware acceleration. KPIs also facilitate communication between technical teams and executives by translating technical progress into business terms, enabling informed decision-making.
What role do accuracy and speed play in AI benchmark evaluations?
Accuracy and speed are the dynamic duo of AI benchmarks. Accuracy ensures the model’s outputs are correct, while speed (latency and throughput) ensures those outputs arrive in time to be useful. High accuracy with poor speed can ruin user experience; blazing speed with poor accuracy wastes resources and damages trust. Effective benchmarks measure both, often highlighting trade-offs that teams must balance.
Which KPIs are critical for assessing AI model scalability and robustness?
For scalability:
- Throughput (queries per second)
- Resource utilization (GPU hours, memory footprint)
- Cost per inference
For robustness:
- Performance under domain shift
- Adversarial attack resistance
- Error consistency across subpopulations
These KPIs ensure models can grow with demand and maintain reliability in diverse environments.
Reference Links and Authoritative Sources
- MLCommons MLPerf Benchmark: https://mlcommons.org/en/
- Stanford HELM: https://crfm.stanford.edu/helm/latest/
- OpenCompass AI Benchmark: https://github.com/OpenCompass/benchmark
- NVIDIA DGX Cloud: https://www.nvidia.com/en-us/data-center/dgx-cloud/
- Intel AI Analytics Toolkit: https://www.intel.com/content/www/us/en/developer/tools/oneapi/ai-analytics-toolkit.html
- Weights & Biases: https://wandb.ai/site
- Fairlearn (Microsoft): https://fairlearn.org/
- Aequitas Bias Audit Toolkit: https://aequitas.dssg.io/
- Luth Research: Where Can I Find Benchmarks for AI Agent Ranking in 2026? https://luthresearch.com/glossary/where-can-i-find-benchmarks-for-ai-agent-ranking-in-2026/
- Gartner on AI KPIs and Sustainability: https://www.gartner.com/en/documents/3987030
For more on AI business applications and infrastructure, visit our internal resources: